Difference Between 100K Fault And 250K Fault In Geovic?

Prospecting Australia

Help Support Prospecting Australia:

This site may earn a commission from merchant affiliate links, including eBay, Amazon, and others.
Joined
Aug 13, 2018
Messages
2,060
Reaction score
4,344
Just wondering if anybody can shed some light on something that has bugged me for some time. I've checked in GeoVic but still don't get the answer to my question.

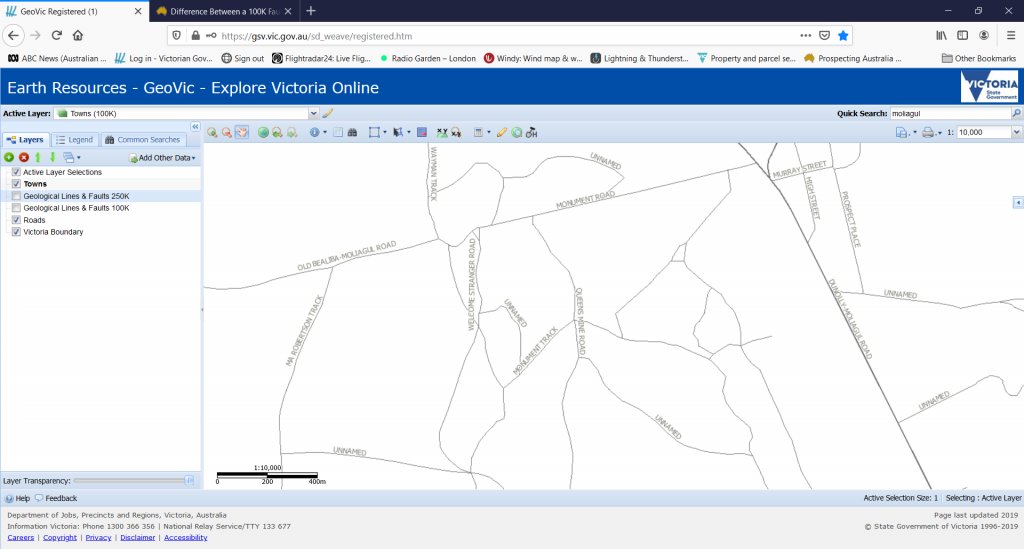
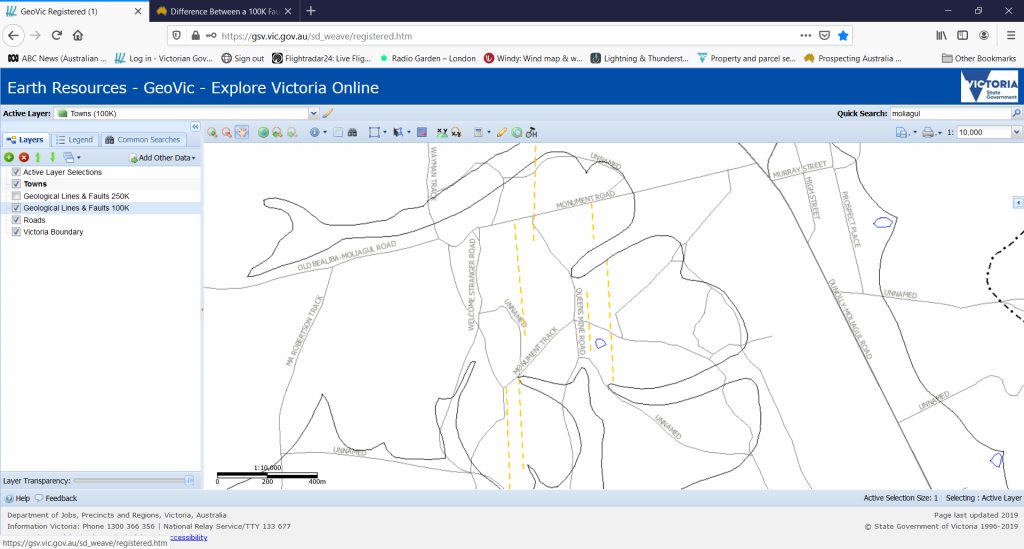
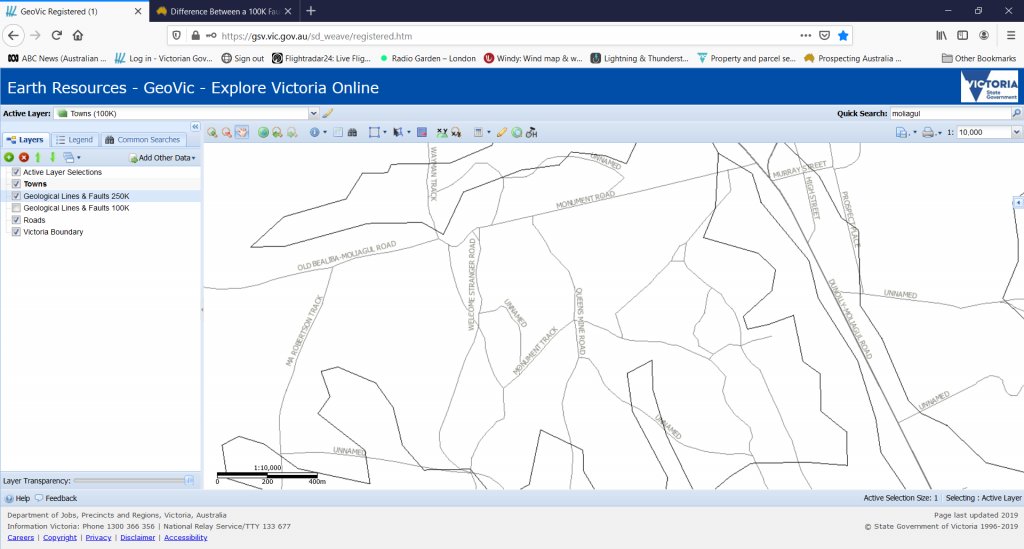
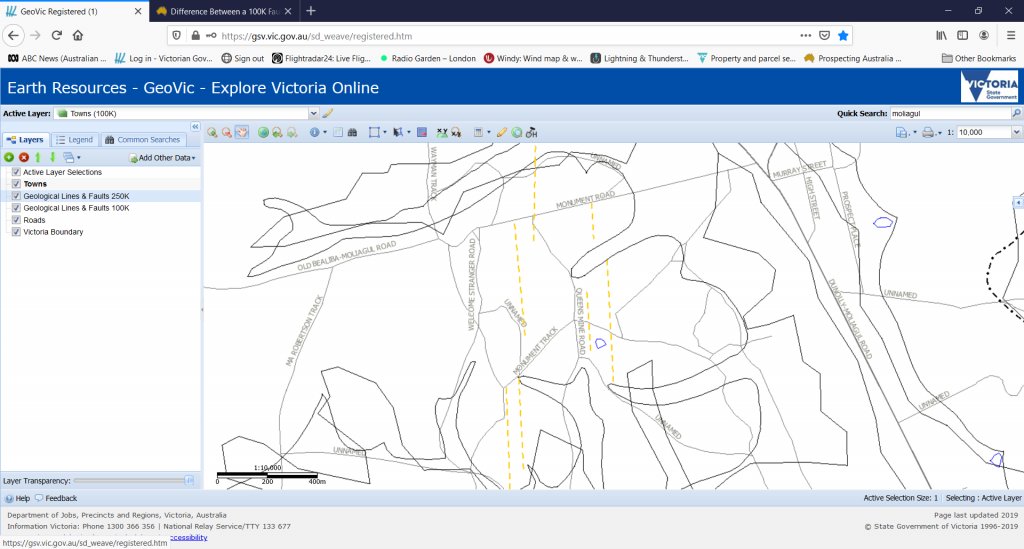
When looking at any particular area on a map in Victoria, if you choose "Faults and Lines 100K", it brings up a heap of fault lines including veins. If you then choose "Faults and Lines 200K" it brings up another set of fault lines. Thing is, they are so often very, very different. When I first went on to GeoVic some time back, I had assumed that they were perhaps the same thing at a different scale i,e., 1:100,000 or 1:200,000. But that doesn't makes sense at all, seeing as you would still expect them to be somewhere in the same vicinity. So what is the difference between a 100K fault line and a 200k? Is it some kind of intensity/magnitude, gap size, type of fault or what?

It's times like this I wish I had a search light like they used for Batman in Gotham City. Except with Goldierocks avatar on it :lol:
 
It's map scale I would think. Detail at 1:200,000 will be more general than the same feature detail at 1:100,000 so if you overlay vector data that is drawn for a map scale of 1:200,000 on vector data drawn for a map svale of 1:100,000 there will be a difference which becomes more extreme to you the more thst you zoom in. So a small difference in the overlaid vector data would equate to a big difference on the ground, ie 1cm difference would be 1km at a scale of 1:100,000.
 
Thanks for your reply goldierocks, and in reply to your suggestion I have picked an area that most members in Victoria would be familiar with in the GT for a recognizable example- Moliagul.

So, in this first picture I have done a screen capture from GeoVic of the general area of Moliagul in Vic-

1621845186_moligul1.jpg


Then, I have done a screen capture of the same page with the "Geological Lines & Faults 100K" overlay selected, which of course includes the veins depicted as yellow dashes-
1621845366_moliagul3.jpg


Here now is the exact same page with the "Geological Lines & Faults 100K" overlay turned off, and the "Geological Lines & Faults 250K" overlay turned on.
1621845489_moliagul2.jpg


Now, here is the same page with both the "Geological Lines & Faults 100K" and the "Geological Lines & Faults 250K" overlays turned on together. As you can see, in some places they even cross each other at right angles.
1621845569_moliagul4.jpg


So, what I can't understand is, are we looking at (for example) one overlay showing little cracks and faults for one of the views and another overlay showing big cracks and faults in another? Just what are the 100K and 200K views showing? And, what defines whether a line or fault is in the 100K view or the 200K? Just what exactly do these various K values represent?
 
100K means 1:100,000 map scale.

Datasets may come from different surveys - the 250K dataset may be from an older survey with poorer detail

The features are the same features, just different detail and accuracy

The dotted line faults are interpreted, meaning they didnt observe them, they inferred them

I defer to Goldierocks to correct me as needed and elaborate
 
Thanks for your suggestions so far guys. I kind of understand what you're getting at diggit, but still think it wouldn't make sense. If we looked at a map of Melbourne at 1:100,000 with Elizabeth St running through the middle of it and all of it's various other streets and lanes, and a map at 1:250,000 with Elizabeth st running through the middle of it with the same streets and lanes, we still have the respective roads,lanes, etc., all in the same place in relation to the buildings, just shown in a different scale.

Equally BrokeInBendigo, surely if the 100K layer is a more recent/accurate survey, then it would just make the 250K survey redundant, in which case why use it at all? And maybe Geology isn't an exact science, but in other areas when using these two different layers they are just so different as to seemingly have no relationship to each other at all. Surely using modern magnetic aerial survey equipment they could get a fairly accurate idea of whether a fault actually ran north/south or east/west?

Hopefully goldierocks can chime in, and maybe even give us an idea of whether or not we should be completely ignoring the 250K data?
 
If only someone who designed many systems such as geovic or a land surveyor or cartographer could chime in. :D :lol:

How Scale Affects Feature Representation

The larger the scale of the map, the better the features that can be detailed. A map that shows the water network of a small area may show the river as a polygon layer and will show the tributaries of that river. A small scale map covering the area would show that same river as a line feature and the tributaries would be removed (a process known as generalization). The smaller the scale of the map, the less the actual detail of a feature is preserved. Smaller scale maps have river features that have the lines smoothed out whereas a large scale map would show more detail about the twists and turns of that same river.

So why not show the same level of detail regardless of the map scale? There are two main reasons. The first reason is the noise level. Showing a lot of detail for features on a small scale map would cause a lot of confusion on the map. By reducing the amount of detail to show only the most important aspects of a feature, the map shows a clearer picture of the area. The second reason is the file size. Features that have a lot of detail are larger in file size. For a small scale map, loading several large layers will slow down the map production.
 
What diggit wrote about scale

Also it takes ages to load that much detail! File size, noise an software performance are factors

Keep in mind you are looking at *geological lines* and faults. The faults generally run N-S. Those other squiggly lines are, without looking at that dataset, geological unit boundaries. That is to say, where different units and formations meet. They are not faults!

For example, you may have alluvium along a watercourse, some colluvium around it where rocks are brought down the surrounding hills, and some other general formation where there are no watercourses or fluvial deposits. The boundaries between these units are the squiggly lines.

Geovic is amazing for a web app but it is very confusing. Check out the pre-digital geology map series and learn to read that, then have a look at the digital data in geovic. Or use a GIS software and import the data for an actually usable experience.

Edit: a dataset may cover large areas in 250k, and then certain smaller regions within that area are covered by 100k. So for some places you can use 100k only, so long as you are ok with the high detail and performance, but you still need the 250k layer for regions 100k doesnt cover.
 
Thanks guys, so the area I'm actually looking at is on my own property in the GT. It is well covered with the 100K overlay, so going by your contributions above it sounds as though the 100K is all I need. It's interesting too, in that one of the old brick outbuildings a long way from the main house, has lost two of its walls over the years for no apparent reason. When you look at the property using the 100K overlay though, a fault line runs directly across where those two walls used to be! However, when you use the 250K layer, there aren't any geological lines or faults on the property at all, in fact none come even close.
 
Interesting about those walls!

From the looks of your data, the geological boundaries (not faults) have better detail in 100k, but the faults are only available on the 250k dataset. Another reason to consult both.

Im not sure if geovic supports this, but in a GIS application, I would configure the symbols for the various feature types so that I see the boundaries from 100k and the inferred faults from the 250k, getting all relevant data without the lower detail 250k unit boundaries.
 
Just had a quick look as going out, but the "geological lines" do not appear to be fault lines but geological contact lines, representing the different geological formations. And their accuracyis less at 250K than at 100K I suspect because they are not simply the same thing at different scales, but (MOSTLY) the same thing taken from 250K mapping and 100K mapping. Different maps compiled from mapping at different times. So the 100K mapping will be the more accurate. For example, I would guess that there is a gully north of and parallel to the Bealiba-Moliagil road and that you are looking at the contact of the alluvium in that gully.

Note that faults are available at 100K as well as at 250K.
 

Latest posts

Top